


A top down analysis of the real estate market Factors affecting demand
A former top rated equity analyst and Amwal’s Head of Asset Management, Afa Boran gives a detailed analysis of Turkish Real Estate Market with past figures and future predictions.
Publisher: Cityscape Magazine
Date :01 March, 2016
" 7 years ago only the top 20% could afford mortgage. Now this number is likely closer to 25%, and even assuming some slowdown in growth. 7 years later this could be easily above
30-35% of the population, which means a further 20-25% increase in addressablemarket for real estate."
Firstly, can you share with us your top down view of real estate market?
" 7 years ago only the top 20% could afford mortgage. Now this number is likely closer to 25%, and even assuming some slowdown in growth. 7 years later this could be easily above 30-35% of the population, which means a further 20-25% increase in addressablemarket for real estate."
An investor’s aim is always to make a good return from their investments, and although past returns are not best indication of future returns, they are still a useful barometer. So let me start with analysing past prices. An important note on available real estate price indices is that they all have some short comings. First, it is difficult to know actual prices on every transaction, and further transactions are not frequent for exact/similar properties. Essentially this industry is quite different from the stock market where prices are readily available.
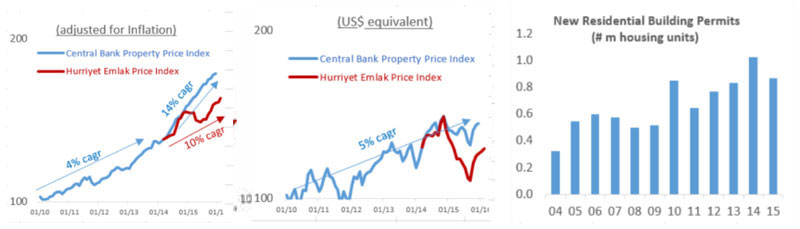
In recent years the Central Bank, Hürriyetemlak and a few property broker/consultants started publishing their own real estate indices. Hürriyetemlak has the advantage of being the most popular portal for listings, and the Central Bank Index has the advantage of being able to collect valuation prices from banks when they extend mortgage loans. Below are both indices for Istanbul, adjusted for inflation and stated in USD. I prefer prices adjusted for inflation, as exchange rate can be volatile from one year to another and most buyers are Turkish Lira earners, although certain neighbourhoods also have foreign buyers. According to government statistics foreigners bought a total of 43,000 housing units in the last three years.
We see from the charts that property prices in Istanbul over the past 6 years have risen by 9% per year when adjusted for inflation, and 5% per year in US$ terms. Hurriyetemlak website also allows one to see price indices broken down by districts and neighbourhoods. One interesting observation I had is some (mostly high end) neighbourhoods actually stayed broadly flat during this period while mid to lower end priced neighbourhoods saw
big increases.
What are the key drivers of property prices?
As it is the case for any asset, prices are a function of demand vs supply, and more specifically for real estate, demand is a combination of population growth, per capita income growth and interest rates. In the last 7 years, Turkey had average 1.5% pa population growth and around 2% per capita income growth. These are high numbers even compared to most rapid growing emerging markets. On top, very importantly, interest rates declined in Turkey particularly notably between 2002-2010 from around 70% to as low as 7-8% in 2013, then has recently risen to 12%. Excluding the recent rise, between 2002 and 2013, there were strong tail winds helping the property market. The recent rise in interest rates will likely slow down property demand but longer term, if interest rates continued their decline, this is something that could have a very important positive impact on demand. Following chart shows how declining interest rates led to a sharp increase in mortgage demand, and yet the lowest level rates declined was around 10% levels.
So, how many can now afford a mortgage loan?
According to latest government statistics, lowest 10% of the population earns around US$ 3,000 a year, while the highest earns around US$ 35,000. If we take US$ 70,000 as the lowest price
for a two bed house and one needs to put around 25% as down payment to get a mortgage loan, he/she will have to make around US$ 650 monthly payments at current Turkish mortgage rates. Before the recent interest hikes, this would have been more like US$ 500. This would put the cut-off point for household income a year likely around US$ 18,000. 7 years ago only the top 20% could afford mortgage. Now this number is likely closer to 25%, and even assuming some slowdown in growth. 7 years later this could be easily above 30-35% of the population, which means a further 20-25% increase in addressable market for real estate. This also explains the likely higher increase in prices for mid to lower end priced houses.

Is low-end segment most attractive part of the market?
From demand point of view yes and historically has seen highest price increases but supply particularly for those segments have been increasing dramatically as well, so one needs to consider the broader picture and analyse carefully supply outlook by neighbourhood. According to government statistics, total new zoning permits for housing the last 10 years housing added up to around one billion sqm (or around 7 million housing units). This is a very large increase considering total number of urban households in Turkey is around 14 million (20 million including rural households). If Turkey eventually manages to bring interest rates down to low single digits, like most other countries, demand upside could be material. In a near zero interest rate world, this looks more possible now than before.
You’ve indicated that recent history show an increased appetite for real estate with decline in interest rates. Can you name other key factors that would potentially increase demand?
From a macroeconomic point of view, interest rates and personal income growth are the most important ones. For interest rates to decline further, there also has to be additional financing
channels other than banks and a securitisation market for mortgage loans. This was an important factor for increase home ownership not only in the US but also in other emerging countries like India. Also worth adding is from a foreign investor point of view, investing after the currency having been devalued is the right time, so I would expect more foreign interest in Turkish real estate going forward.
 New Takaud And Amwal Partnership Expands
  A top down analysis of the real estate market Factors...
  Amwal launches GCC fund with German firm
  Doha Bank plans to launch ETF on QE